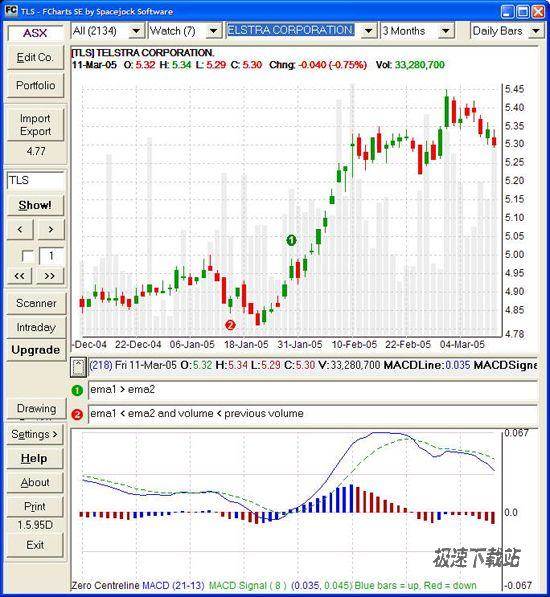
FCharts是一个免费的股票图表软件程序,将进口价格从多种来源的数据,显示OHLC,烛台和折线图。它有一个内置指标(MACD指标,RSI,指数(EMA)和标准的移动平均线(SMA)及以上),或者你可以写你自己内置的公式语言,并显示它们作为独立的图表或覆盖。您还可以用鼠标点击几画趋势线,并在全彩色或黑白打印或保存您的图表。

FCharts is a free stock charting software program which will import price data from a wide range of sources, displaying it as OHLC, Candlestick and Line charts. It has a number of built-in indicators (MACD, RSI, Exponential (EMA) and Standard Moving Averages (SMA) and more), or you can write your own with the inbuilt formula language and display them as standalone charts or overlays. You can also draw trend lines with a few clicks of the mouse and print or save your charts in full colour or black and white.
相关下载
发表评论
网页评论
- 共 0 条评论,平均 0 分 我来说两句
- 人气英雄联盟下载官方下载
- 《英雄联盟》(简称LOL)是由美国拳头游戏(Riot Games)开发、中国大陆地区腾讯游戏代理运营的英雄对战MOBA... [立即下载]
- 好评360免费WiFi 5.3.0.5005 官方版
- 360连我WiFi是360公司比较新推出的一款虚拟路由器软件,它可以真正实现一键让电脑变为Wifi热点,使你的手机... [立即下载]
更多同类软件推荐
更多股票证券排行
- 28439中国银河证券双子星 3.2.19 云服...
- 18997e海通财 2.7.0.151 官方版
- 14008中投证券合一版 7.27 官方版
- 12601中国银河证券海王星 2.55 官方版...
- 12246优品股票通PC端 4.5.2 官方版
- 9610湖南抄底王 9.5 免费版
- 7993东方财富通达信 1.05 官方版
- 7773同花顺 8.80.22 官方版
- 7127彩红时时彩计划软件 1.1.0.0 绿色...
- 6369智远一户通智能版 6.18 官方版

